
Market data
Where the money is going: warehouses and suburban retail are outperforming homes
While prime home rents fell, industrial occupancy held above 80% and mall footfall rose about 15%. A look at which parts of Kampala property are actually working, and what that means for ordinary investors.
Yellow Bricks Uganda team · 13 September 2026 · 3 min read
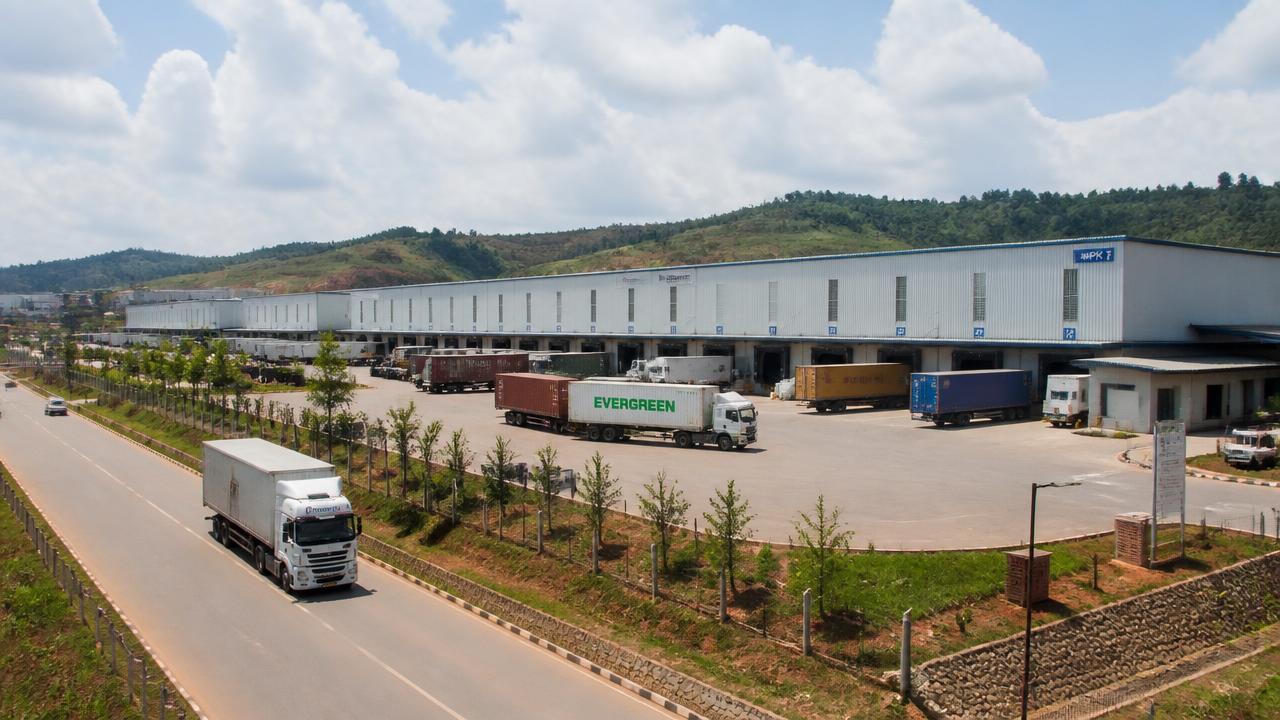
Most conversations about Ugandan property are about houses and land. Knight Frank Uganda's H2 2025 review suggests the money has been quietly working somewhere else: warehouses, and the small convenience retail spreading through Kampala's suburbs.
- Average industrial occupancy across key zones
- >80%
- Average industrial occupancy across key zones
- New warehouse space delivered in Greater Kampala
- 50,000+ sqm
- New warehouse space delivered in Greater Kampala
- Footfall growth across managed malls
- +15%
- Footfall growth across managed malls
- Change in average spend per shopper
- -1%
- Change in average spend per shopper
Source: Knight Frank Uganda, Kampala Property Market Performance Review, H2 2025. Figures describe Knight Frank's managed and prime portfolio.
Industrial: the quiet winner
Occupancy across major industrial corridors consistently exceeded 80%, and rents stayed firm even as new supply landed. The drivers named in the report are specific: expansion in coffee exports, which reached US$2.4 billion, preparation ahead of oil production targeted for the second half of 2026, and continued growth in FMCG manufacturing and third-party logistics. Modern, well-located warehouse space is scarce, and occupiers pay for it.
Namanve prices lowest, with leasing temporarily constrained by ongoing infrastructure works. Older, poorly serviced facilities remain price sensitive.
| Location | Rent per sqm per month |
|---|---|
| Traditional Industrial Area (1st–8th Street) | US$4.50 – 7.00 |
| Ntinda–Nakawa corridor | US$4.50 – 6.50 |
| Nalukolongo Industrial Area | US$4.50 – 6.00 |
| Kampala Industrial Business Park (Namanve) | US$3.00 – 5.00 |
Source: Knight Frank Uganda, Kampala Property Market Performance Review, H2 2025. Figures describe Knight Frank's managed and prime portfolio.
Read that table as a map of infrastructure rather than of prestige. The Traditional Industrial Area commands the premium because it is established and close to the central business district. Namanve is cheapest partly because the works are still going in. Our reading is that the gap narrows as those works finish — but that is our inference, not a Knight Frank forecast.
Retail: more feet, thinner wallets
Average footfall across Knight Frank-managed malls grew about 15% year on year, with surges in July, November and December. Yet average spend per shopper softened by around 1%, reflecting price sensitivity. Occupancy improved only marginally, about 1%, because prime malls are close to saturation.
Year-on-year change across managed malls, H2 2025.
Source: Knight Frank Uganda, Kampala Property Market Performance Review, H2 2025. Figures describe Knight Frank's managed and prime portfolio.
The interesting movement is away from the big malls. The report describes growth in mini-supermarkets, eateries and neighbourhood convenience formats — the sort of 500 to 1,000 square metre units that sit where people actually live. Landlords are also adopting mixed-use configurations, and upper floors of retail buildings remain hard to let while ground, first and second floors achieve occupancies above 80%.
Offices moved the tenant's way
Grade A offices averaged US$17 per square metre per month at 84% occupancy, and Grade AB US$15 at 80% — a roughly 4% decline in occupancy year on year, with rents down about 3% for both grades. Around 50,000 sqm of office space was added in H2 2025 and over 200,000 sqm sits in the pipeline. More supply, softer terms, better deals for occupiers.
| Grade | Average net monthly rent per sqm | Average occupancy |
|---|---|---|
| Grade A | US$17 | 84% |
| Grade AB | US$15 | 80% |
Source: Knight Frank Uganda, Kampala Property Market Performance Review, H2 2025. Figures describe Knight Frank's managed and prime portfolio.
Homes softened, sheds held. That is not a Kampala quirk — it is what happens when trade grows faster than incomes.
What this means if you are not a fund
- Small commercial space in a busy residential area — a shop, an eatery, a mini-supermarket unit — is where the demand growth is, and it is within reach of ordinary Ugandan investors in a way a warehouse is not.
- Location logic differs from housing. Access, parking, loading and the road matter more than the view.
- Commercial tenants ask harder questions and expect proper documents. Have the title, the lease terms and the service charge clear before you advertise.
- If you are taking over an existing shop, understand goodwill and what you are actually buying before any money changes hands.
What this means for you
- Industrial occupancy stayed above 80% with warehouse rents of US$3.00–7.00 per sqm per month.
- Coffee exports of US$2.4bn and oil production targeted for H2 2026 are the demand drivers named.
- Mall footfall rose about 15% while spend per shopper fell about 1% — more visits, tighter budgets.
- Suburban convenience retail of 500–1,000 sqm is the growth format.
- Offices turned tenant-favourable: Grade A US$17/sqm at 84% occupancy, 200,000+ sqm in the pipeline.
The full review is published by Knight Frank Uganda at knightfrank.ug. Yellow Bricks Uganda lists commercial as well as residential property, with rent, deposit and any fees stated up front.
Where Yellow Bricks fits
We are a fixed-fee estate agency built for Uganda: every listing starts with a pin on the map, a drawn and measured boundary, and ownership documents reviewed before it goes live. This article is general information, not legal or financial advice — use your own lawyer and surveyor.
Keep reading
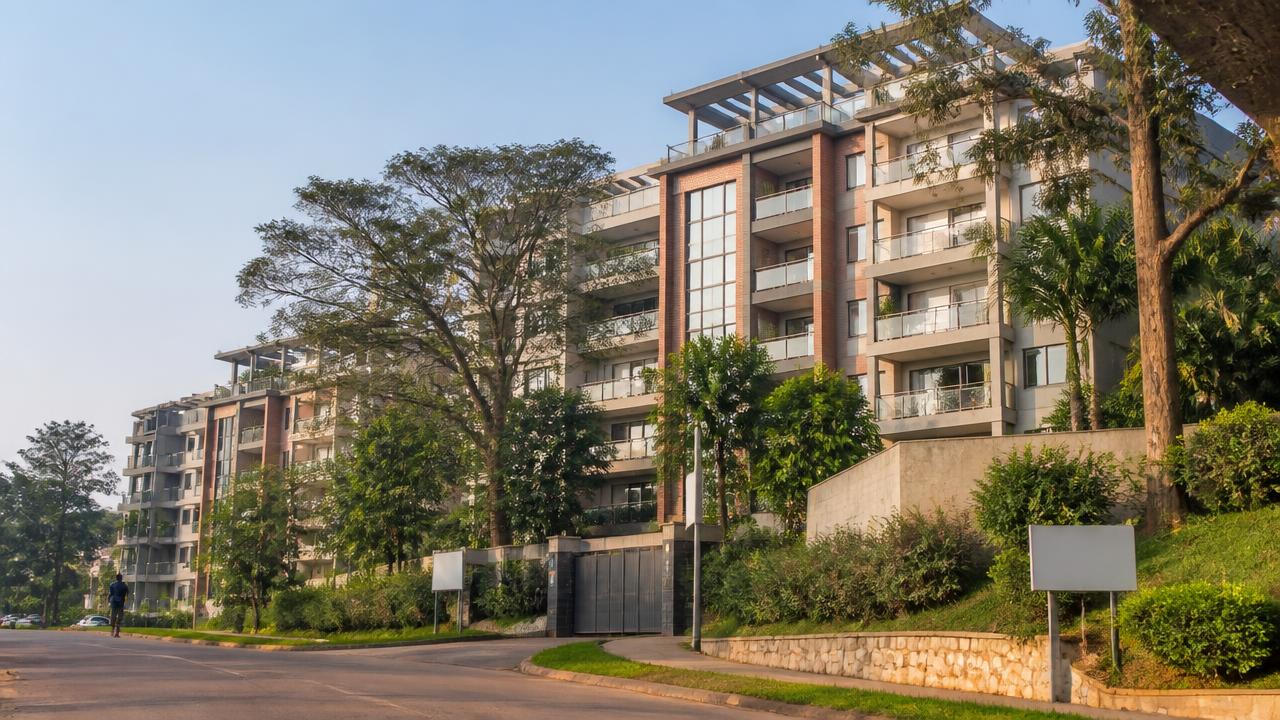
Kampala rents have turned in the tenant's favour — what the numbers say
Prime two-bedroom rents fell about 10% and three-bedroom rents about 9% over the year, while occupancy edged up. Here is what that means if you are renting or letting a home in Kampala today.
15 September 2026 · 3 min read

What it costs to borrow for property in Uganda right now
The Central Bank Rate sat at 9.75% while banks lent shillings at an average 19.07%. Here is why property borrowing is expensive, who is getting approved, and what to ask a bank before you sign.
11 September 2026 · 3 min read

The economy behind Uganda's property market: 6.3% growth, 3.1% inflation, a steady shilling
Growth of 6.3%, inflation at 3.1%, a shilling up 2.4% and a record balance of payments surplus. The macro picture that sits underneath every rent, price and loan in Kampala.
9 September 2026 · 3 min read